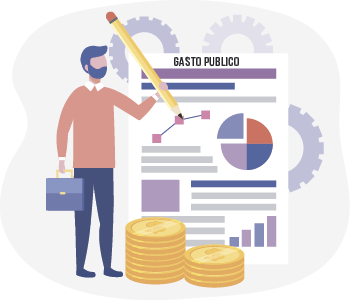
Monitor de inflación y precios
Conocé cómo evolucionan los precios de los bienes y servicios de la economía, cómo varian los precios relativos y cómo lo hacen en comparación con los salarios.

Empleo y salarios
Conocé todas las estadísticas del mercado laboral, evolución y composición de trabajadores, salarios en dólares, participación por género y mucho más.

Salud Escolar
La Encuesta Mundial de Salud Escolar releva las problemáticas de alumnos relacionadas con el consumo de alcohol, tabaco y drogas, bullying y violencia física, entre otros tópicos.
DNU 70/2023 y Ley Ómnibus
El día 21 de diciembre de 2023 se publicó el decreto de necesidad y urgencia titulado “Bases para la Reconstrucción de la Economía Argentina” y el 27 de diciembre de 2023 se envió al congreso la ley titulada "Bases y Puntos de Partida para La Libertad de los Argentinos", conocida como la Ley Ómnibus. Conocé sus principales características, efectos y leyes que fueron derogadas o sufrieron una sustitución o incorporación.
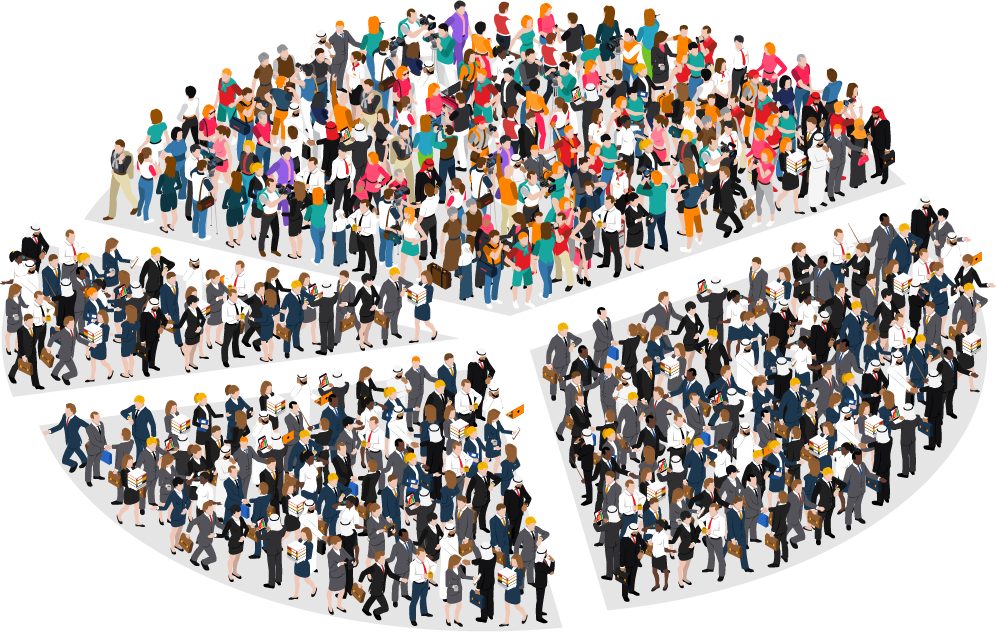
Encuesta Permanente de Hogares
La Encuesta Permanente de Hogares (EPH) llevada a cabo por el INDEC permite conocer las principales características sociodemográficas y socioeconómicas de la población.

Estadísticas de seguridad
El Sistema Nacional de Información Criminal (SNIC) recolecta información sobre los hechos presuntamente delictuosos registrados en todo el territorio de la República Argentina.
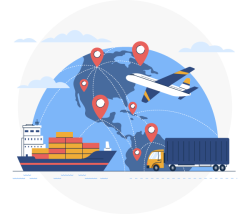
Comercio Internacional
Conocé las principales estadísticas de intercambio de bienes y servicios entre países, contemplando la existencia o no de acuerdos comerciales a lo largo del tiempo.